

![]() 2012 Global Economic Energy Efficiency Ranking
2012 Global Economic Energy Efficiency Ranking
![]() The Performances between Advanced Economies and Emerging and Developing Economies in Economic Energy Efficiency are Well-Matched
The Performances between Advanced Economies and Emerging and Developing Economies in Economic Energy Efficiency are Well-Matched
![]() The Economic Energy Efficiency Ranking of Taiwan Has Fallen 4 Places
The Economic Energy Efficiency Ranking of Taiwan Has Fallen 4 Places
![]() Annex 1. Global Economic Energy Efficiency Ranking
Annex 1. Global Economic Energy Efficiency Ranking
![]() Annex 2. Global Energy Consumption, Real GDP, and Nominal Per-capital GDP
Annex 2. Global Energy Consumption, Real GDP, and Nominal Per-capital GDP
![]() Annex 3. Average Growth Rate of Energy Consumption, Real GDP, and Difference (20005-2009)
Annex 3. Average Growth Rate of Energy Consumption, Real GDP, and Difference (20005-2009)
![]() 2012 Global Economic Energy Efficiency Ranking (Download)
2012 Global Economic Energy Efficiency Ranking (Download)
Based on the Global Economic Energy Efficiency Index (EEEI) , published by the Triple-E Institute and Department of Economics, Chinese Culture University, prior to Earth Day 2012, the global economic energy efficiency in 2009 has improved 6.03% in total compared to the base year of 2005. Professor Yunchang Jeffery Bor, President of the Triple-E Institute and Head of the Department of Economics, Chinese Culture University, has indicated that, according to the EEEI, there are 85 countries that have made a positive contribution to the world’s economic energy efficiency and 44 countries have had a negative effect on the world’s economic energy efficiency. Among all countries that have made a positive contribution, the United States is ranked in first place, China is in second place followed by Russia, and Germany is in fourth place.
Energy has become a critical necessity to economic development and modern living standards since the industrial revolution beginning from 1975. However, the earth’s limited supply of fossil fuel is eventually going to be depleted. A shortage of energy resources and rapid economic growth push energy prices sky high again and again. Therefore, how to use energy resources efficiently has become one of the most important topics in the world. Energy efficiency can lessen the impact of high energy prices, improve energy security, and mitigate the global warming problem on mother earth. Improving energy efficiency is also the most cost-effective, ready-to-go and no-regrets strategy.
The present EEEI1 ranking contains 129 of the world’s countries. The final energy consumption comes from Energy Balance, published by the International Energy Agency (IEA). The real gross domestic product is derived from the Value-added Statistics of the United Nations Statistics Division (UNSD). The top ten ranking countries are: the United States, China, Russia, Germany, Ukraine, Spain, the Republic of Korea, the United Kingdom, France, and Uzbekistan. The main contribution in terms of the improvement in EEEI in the United States and Russia comes from the transportation department. Although the energy demand in China is very strong due to economic development, the growth rate of real GDP is even more rapid than the growth rate of energy consumption. This leads to the positive result for EEEI in China. As for Taiwan, the performance in terms of the EEEI in 2009 is not so impressive, it being ranked in 16th position (down 4 places compared to 2008).
India has a huge population and its economic development is surging. However, the growth of energy consumption2 is too fast (especially the use of coal) to be compressed by economic growth. The EEEI for India is the worst in the world in 2009 and the major cause is the inefficiency of energy use in the agricultural and service sectors. Another bad example is the United Arab Emirates. Although the United Arab Emirates enjoys a huge oil-dollar benefit by exporting crude oil, the wastage and poor performance of energy use in the manufacturing sector makes its EEEI the second worst in the world.
1. Please refer to Bor, Y.J. (2008). “Consistent Multi-level Energy Efficiency Indicators and their Policy Implications.” Energy Economics 30: 2401-2419 for the notation. The base year of the EEEI is 2005 and the latest global updated data is 2009.
2. The data for household energy, non-energy, and own-use energy are not counted because of no corresponding economic output, non-fuel use, and no applicable sectoral distribution.
.jpg)
.jpg)
![]()
![]() The Performances between Advanced Economies and Emerging and Developing Economies in Economic Energy Efficiency are Well-Matched (Download)
The Performances between Advanced Economies and Emerging and Developing Economies in Economic Energy Efficiency are Well-Matched (Download)
According to the International Monetary Fund (IMF), there are 34 countries that are in the category of Advanced Economies (AE). Therefore, the rest of the 95 countries in the present report all belong to the category of Emerging and Developing Economies (EDE). However, due to the global shortage of fossil energy, most of the countries are highly focused on improving energy efficiency. Based on the latest economic energy efficiency index (EEEI), global energy efficiency improved 6.03% in 2009 compared to the base year of energy efficiency in 2005. Within that, the AE have made considerable effort in improving energy efficiency of 3.37% since the Kyoto Protocol came into effect on February 16, 2005. On the other hand, energy efficiency goes up by 2.65% for EDE, which is also a remarkable outcome in 2009.
In 2009, the share of global population for AE was only about 15%; however, the share of global GDP for AE was about 72% and the share of final energy consumption was about 43%. These numbers show that AE is actually enjoying the economic fruits and using up the majority of the energy resources from mother earth. Therefore, the responsibility to improve economic energy efficiency should be better than the performance of the above 3.37% so as to lead the world. Looking into the geographic performance in AE, the North American region leads with 1.68%, followed by the European region with 1.32%, the Asian region with 0.28%, and Oceania with 0.09%.
The leading country in North America is the United States that contributed 1.59% to economic energy efficiency in 2009. The United States has tried hard to switch from being an energy waste country in the 1990s to becoming the top ranking EEEI country in the world. The economic potential and technological strength of the United States cannot be ignored by the world. Germany is the leading country in terms of EEEI in Europe with a contribution of 0.32% in 2009. The practice of either energy saving or new energy developing in Germany is always highly acknowledged by the world. One of the most impressive issues is that the new energy and energy efficiency business has not slowed down the economic growth in Germany. In the Asian region, the new leading country in terms of EEEI is Korea, with a contribution of 0.19% in 2009, because Japan has fallen sharply in terms of economic energy efficiency in the same year. The major reason for the low performance in Japan is not because of energy wastage but because of the severe reduction in economic growth due to the financial crisis in 2009. Nevertheless, the recent economic energy efficiency performance of Korea is strong and stable, and serves as a good example and mirror for Taiwan as well as other Asian countries.
Parallel with the classification of INF, there are six regions for EDE which are: the Commonwealth of Independent States, Developing Asia, Central and Eastern Europe, Sub-Saharan Africa, Latin America and the Caribbean, and the Middle East and North Africa. In 2009, the performances in terms of economic energy efficiency were: 1.22% for the Commonwealth of Independent States, 1.14% for Developing Asia, 0.29% for Central and Eastern Europe, 0.16% for Sub-Saharan Africa, 0.04% for Latin America and the Caribbean, and -0.20% for the Middle East and North Africa.
Among the regions in terms of EDE, the most notable countries are China, Russia, and the Ukraine. The energy resources, especially for coal, natural gas, and oil resources, are abundant in these countries. The populations of China (about 1.35 billion) and Russia (about 0.14 billion) are also very large in the world. However, the performances in terms of economic energy efficiency of these countries are unique and impressive. The contribution of EEEI for China is 1.33%, ranking it second in the world in 2009. The improvement of economic energy efficiency in China is mostly from the industrial sector. The contribution of EEEI for Russia is 0.53%, ranking it third in 2009. The services sector is the main reason for Russia’s improvement. The contribution of EEEI for the Ukraine is 0.27%, ranking it fifth in the world. Both the industrial and services sectors make the contribution. The world center of gravity has gradually moved to Developing Asia and the Commonwealth of Independent States regions.
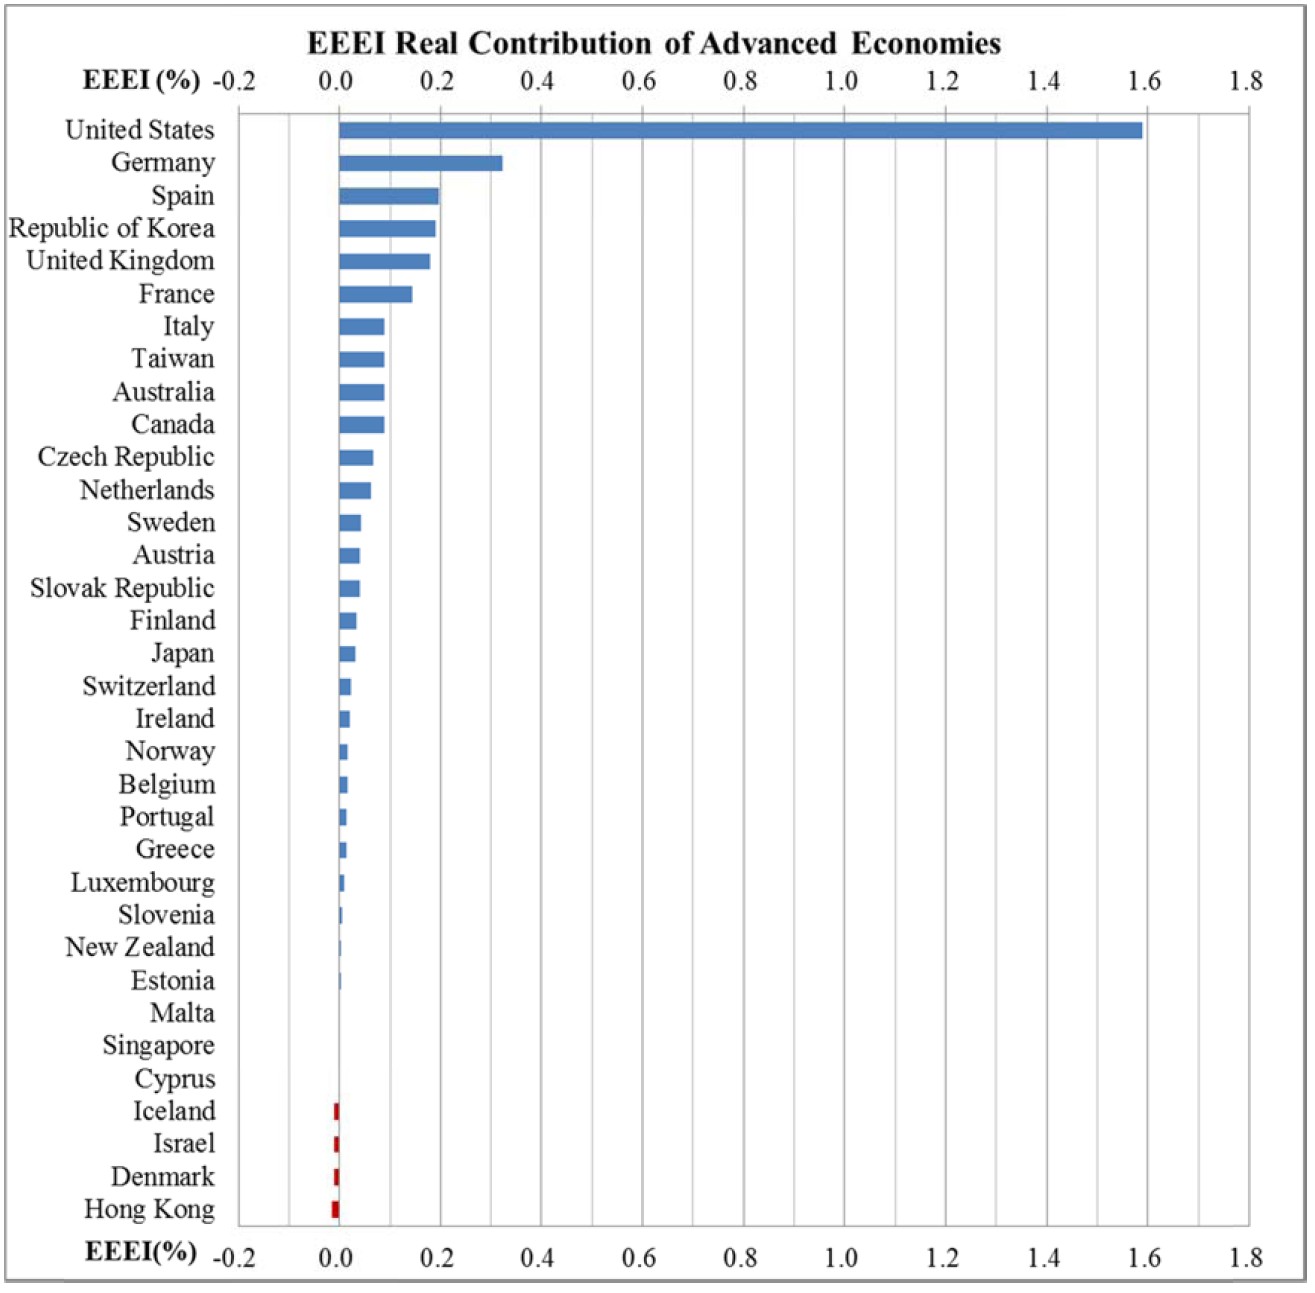
Figure 1: EEEI Real Contribution of Advanced Economies
_EN.jpg)
_EN.jpg)
_EN.jpg)
_EN.jpg)
_EN.jpg)
![]()
![]() The Economic Energy Efficiency Ranking of Taiwan Has Fallen 4 Places (Download)
The Economic Energy Efficiency Ranking of Taiwan Has Fallen 4 Places (Download)
According to the latest Economic Energy Efficiency Index (EEEI) published by the Triple-E Institute, in terms of its 2009 economic energy efficiency ranking Taiwan is in 16th place. Compared to the ranking for 2008, it has gone down 4 places and lags far behind the ranking for Korea (in 7th place). The major reason is the inefficiency in energy use of chemical material manufacturing. The difference in terms of the EEEIs between 2009 and 2008 is -2.81% for chemical material manufacturing. In addition to that, the difference in terms of the EEEIs between 2009 and 2008 is -1.29% for land transportation services, although its economic energy efficiency is the best in the year 2009. Other energy intensive industries, such as non-metallic mineral products, basic metals, paper, textile mills, and plastic products are all worse in terms of economic energy efficiency from 2008 to 2009. Therefore, energy intensive industries are bound to be responsible for the low ranking in terms of economic energy efficiency in Taiwan in 2009.
In order to calculate the vertical decomposition effect of the EEEI, the present report classifies the economy into three large categories: the agricultural sector, industrial sector, and services. Under the three big sectors, there are 33 small industries that cover detailed subsectors. Compared to the base year of 2005, the performance in terms of economic energy efficiency has improved by 6.69% overall, which is a positive but unsatisfactory result. Within this improvement, the biggest contribution to economic energy efficiency comes from services (4.37%), followed by the industrial sector (1.36%), and then the agricultural sector (0.95%). Going down further to the small industrial level, the EEEI shows that land transportation contributes 2.76% to economic energy efficiency, which reveals that about 60% of the contribution is from services that also accounts for the best performance among all industries in Taiwan in 2009. For the industrial sector, the electronic parts, computers and electrical equipment (EPCEE) industry has the second best performance with 2.36%. The EPCEE industry belongs to the non-energy intensive industries in Taiwan. In third place is the petroleum and coal products industry with a contribution of 1.37%. The basic metals industry also contributes 1.19% of the EEEI. The last two industries belong to the energy intensive industries in Taiwan.
On the contrary, there are many industries with worsening performance in terms of economic energy efficiency, such as chemical materials (-5.23%), plastic products (-0.27%), transport equipment (-0.13%), warehousing, transportation and postal services (WTP) (-0.04%), rubber products (-0.02%), mining and quarrying (-0.01%), and machinery and equipment (-0.01%). Among them, chemical material manufacturing is again the critical industry that had a big and negative impact on Taiwan’s economic energy efficiency in 2009. Administrative officials should seriously review the current industrial economic policy as well as energy policy. There are several measures that can solve this problem: (1) eliminate or phase out old factories; (2) move the production chain to low-cost bases located abroad; (3) conduct a full-scale energy audit and trace the factors for the inefficient use of energy; (4) replace the old technology; and (5) promote high value-added production and products. All of the above measures can interact together without difficulty and are also good for any low-performance industry. The key issue is to stop the economic energy efficiency being downgraded and pursue sustainable development in Taiwan.
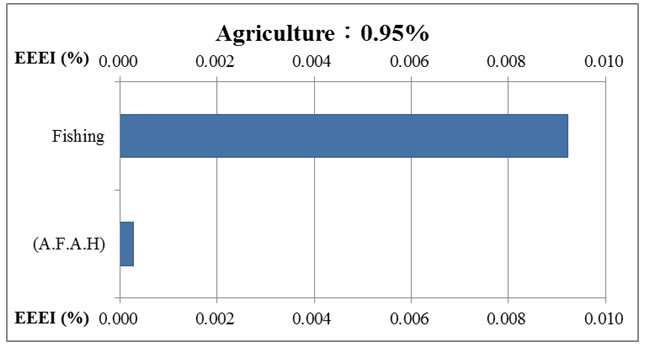
*(A.F.A.H): Agriculture, Forestry and Animal Husbandry
Figure 1: EEEI Real Contribution of Agriculture in Taiwan
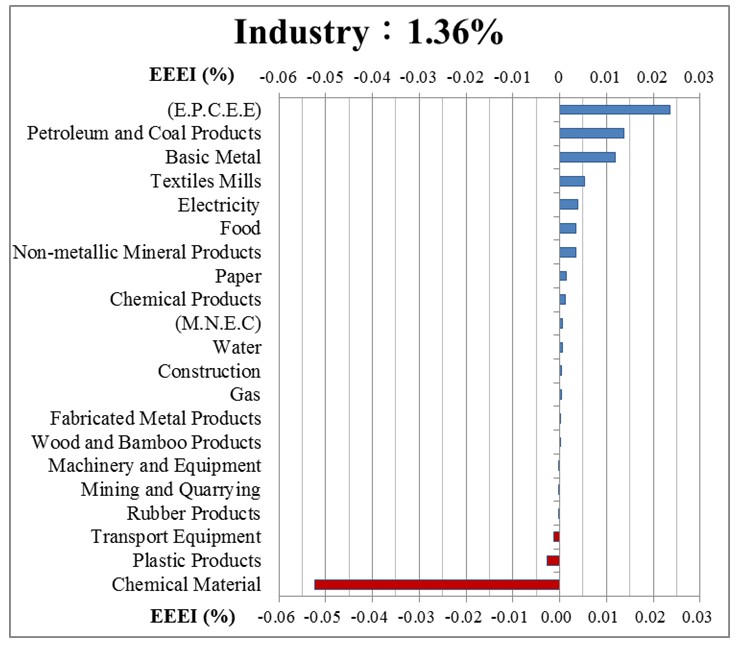
* (E.P.C.E.E): Electronic Parts, Computers and Electrical Equipment
*(M.N.E.C): Manufacturing Not Elsewhere Classified
Figure 2: EEEI Real Contribution of Industry in Taiwan
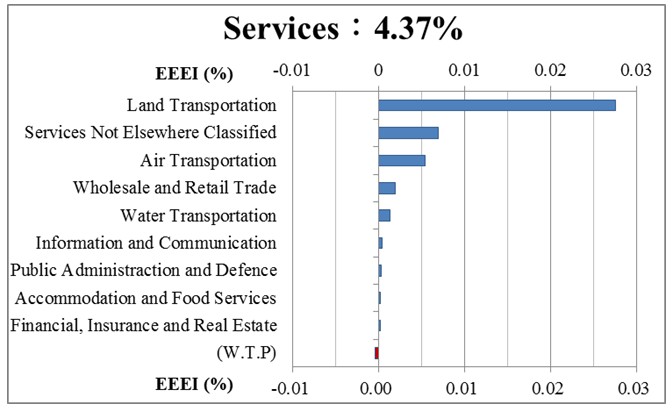
*(W.T.P): Warehousing, Transportation and Postal Services
Figure 3: EEEI Real Contribution of Services in Taiwan
![]()

.jpg)